
🤓 3 formulae for venture philanthropy
TL; DR – This piece proposes 3 formulae for anyone allocating capital for social return: how much impact to expect, how likely you are to get it, and whether it would have happened anyway. Use the formulae to stretch and deepen your thinking, rather than replacing it.
Two things are true about the world right now:
- There’s more money around than ever before (albeit unevenly distributed).
- There’s a lot of things that need fixing.
We urgently need to direct all that capital effectively, to fix problems and make the world a better place. How do we do it?
One approach is funding new ideas — basically treating philanthropic capital like venture capital to seed novel, impactful solutions (sometimes called ‘venture philanthropy’ or ‘catalytic capital’. I’m biased towards this, as I’ve been doing it for almost a decade. But it’s hard work.
There’s deep technical complexity in introducing new ideas to new places, where uncertainty is high. This piece proposes three formulae to break that down. The point isn’t to magically use maths to make decisions. Rather, it’s to use maths to trigger deep and critical thinking. The formulae are a starting point, for anyone considering allocating capital for social return.
I originally put this thinking together as a slide deck for a friend (who leans quant). The original slides are below, and the text is adapted from my voiceover.
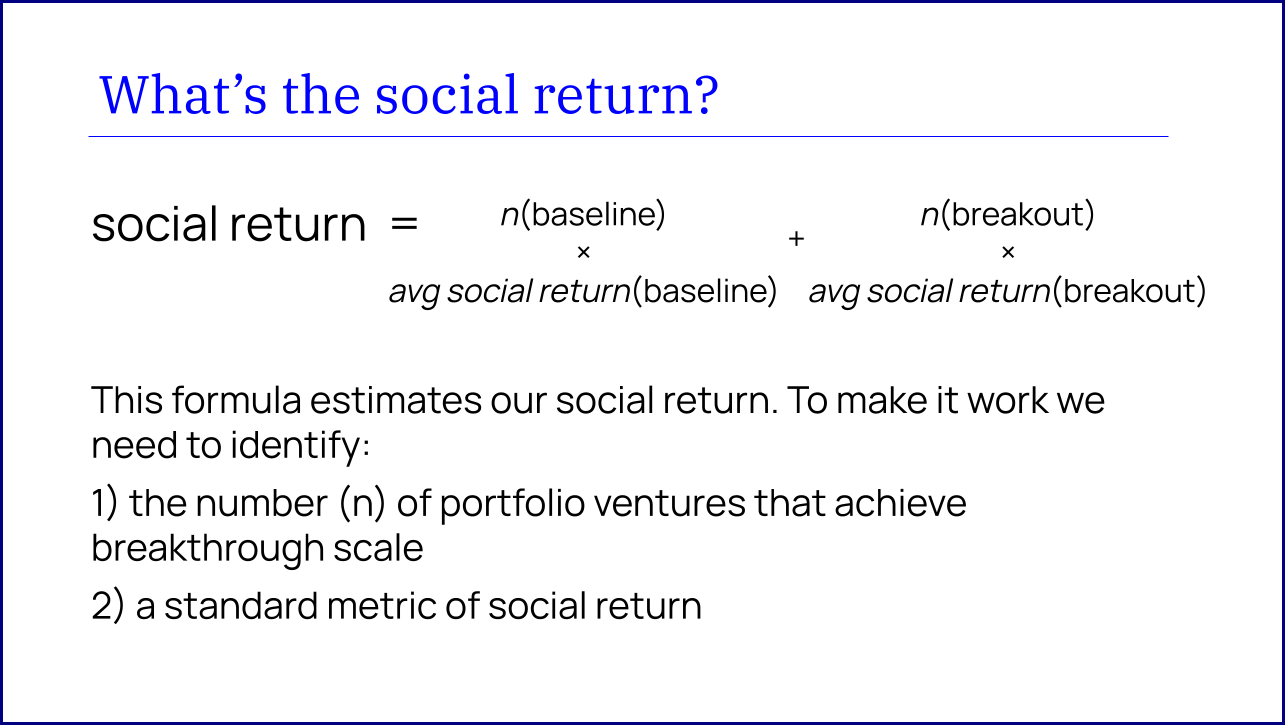
Our first formula captures the thing that matters most: quantifying the social return we can expect from our capital.
Most of our social return will come from a small handful — typically ~10% — of portfolio ventures. That’s been my experience from the ~50 ventures I’ve worked closely with, and the hundreds we’ve engaged across Brink. These ventures achieve or come close to breakthrough scale, which we define as national-level reach over a period of ~15 years¹. In these cases, our funding will be truly catalytic.
The other ~90% of ventures will achieve some social return, but only directly through the funding we provide. In these cases, our role isn’t catalytic, since the amount of impact is only the baseline you would expect as a result of the $$ you provide.
Next, you need a metric for social return. In education, this metric might be standard deviations gained in test scores or lifetime income gain. In health, it might be disability-adjusted life years (DALYs) averted. In climate, tons of CO2 averted. And so on.
Let’s take a real-life fund I worked on: the Assistive Tech Impact Fund. The fund was a £1M proof-of-concept with a target portfolio of 5 ventures. Our thesis was that startups with high-quality products and business model validation could — with venture building support and significant funding — meaningfully improve the lives of millions of people with disabilities in Africa.
When we launched the Fund, there were 135M Africans needing access to an assistive tech device, and not having one (spectacles, wheelchairs, prosthetics, etc)². Getting as many of them as possible access to a good quality device would avert DALYs — giving users back years of good life. To estimate total DALYs averted by a breakthrough venture:
- Take the median country in Africa by population: Guinea, with ~15M people
- Assume 10%³ of Guinea’s population has an unmet need for an assistive tech device: 1.5M people.
- Then, assume we can reach 20% of this user base if we scale up nationally: 300K people.
- Take the average number of DALYs averted by an assistive tech device at ~0.05 years⁴. Each year the device is used, the user is 0.05 points closer to perfect health (on a scale of 0-1).
- Assume our scaled up organisation delivers the product / service continuously to 300K users for 15 years. Each user gets 0.75 DALYs averted over lifetime usage.
- To recap, we’re assuming 300K people get 0.75 DALYs averted — or 225K DALYs averted in total. This means a breakthrough venture removes 225K years of lost healthy life. That’s a lot of life!
The maths is easier for baseline ventures. If our average cheque size is £200K, let’s assume a venture can directly build and deliver ~1.5K devices as a result, that get used over 5 years. At 0.05 DALYs averted per user, that’s 0.25 DALYs averted over lifetime usage, or 375 DALYs in total. Our funding — without any catalytic effect — removes the equivalent of 375 years of lost healthy life⁵.
Of course,‘baseline’ to ‘breakthrough’ is actually a spectrum. We’ve simplified the portfolio into these two archetypes, but in the real world many would fall somewhere in the middle. They might scale regionally, but not nationally, or stay local but sustain over decades.
And of course, we can never be precise with our numbers — there’s just too many assumptions. What we can start to see, though, is an order of magnitude to our social return. This helps us compare DALYs averted across other potential catalytic health funds. Instead of assistive tech, what if we funded new oxygen concentrators? Or supply chain innovation in vaccine delivery? How would our social return differ?
That said, let’s address the thing that sticks out most: the relative impact from breakthrough ventures is insanely high. Let’s take our Assistive Tech Impact Fund target portfolio of 5, and assume 0.5 breakthrough and 4.5 baseline ventures. This means:
- Breakthrough ventures will return 112.5K DALYs (0.5 × 225K) — 98.5% of total social return
- Baseline ventures will return ~1700 DALYs (4.5 × 375)
Even if this is an over-simplification, it signals something crucial — the only goal that matters in venture philanthropy is to find ventures that might be genuinely transformative, and use all the tools you have to catalyse national-level, sustainable scale.
Just like a very small handful of a VC’s portfolio generates most of the financial return, a small percentage of breakthrough ventures will generate most of our social return.

The social return we’ve calculated above isn’t 100% certain. So, how certain is it?
We can estimate this by isolating each critical uncertainty, allocating it a percentage likelihood, and multiplying those together.
Given so much of our social return is dependent on catalysing breakthrough ventures, critical uncertainties will most likely relate to our ability to find, fund, and support enough (~10%+) of them.
This was certainly the case with the Assistive Tech Impact Fund. Looking back, our critical uncertainties were:
- CU₁: finding viable business models. Scaling meant generating income (whether B2C, B2B or B2G) and profitability. This was notoriously difficult in the assistive tech sector, especially in African markets. We needed 5 viable models in our portfolio, with one that could take off and sustain national-level scale. Let’s estimate likelihood at 60%.
- CU₂: finding products people love and use. Assuming viable business models exist, and we can find them, our social return remains contingent on consistent usage. This means a robust product, easy to use and maintain, that genuinely brings value and joy. We’d seen startups building great products — ultimately, some of them ended up as our portfolio companies (including Koalaa’s prosthetics, and Wazi’s glasses). Let’s estimate likelihood at 80%.
- CU₃: startups can absorb relatively large cheques. We were asking small organisations to spend ~$200K responsibly, speedily and effectively. In the context of Africa’s assistive tech sector, this was a relatively large cheque. Let’s estimate likelihood at 70%.
Taking these three critical uncertainties and multiplying them, this sets our overall likelihood of social return at ~34%. And there’ll always be things we hadn’t considered, that would drag this percentage down further.
Important note: this formula only works if each critical uncertainty is fully independent. For example, if an assistive tech product is loved and used, a user will pay for it, making a viable business model more likely. The two are connected.
While we can try our best to keep the critical uncertainties as specific and independent as possible, it’s basically impossible in practice. So ‘unknown unknowns’ drag down the ~34%, while CUs’ lack of independence drags it up. Hopefully, the two cancel each other out 🙂

Would the social return we hope to generate would happen anyway?
After all, we’ll never be the only funder for our venture portfolio. Other funds exist, or will do in the near future, with similar goals. Our second formula asks us to understand two key aspects of the funding landscape:
- p(others would fund our venture portfolio) = What’s the probability that our ventures would receive capital from another funder, for similar ends? Let’s cap the time horizon to 10 years, because no-one knows anything beyond that.
- years gained by doing it now = How long before the progress we’re catalysing would happen anyway? This progress can happen in a few different ways: via government action (policy change, public sector spending, etc), market action (companies act on commercial opportunities), or cultural shifts. Again, let’s cap this at 10 years gained.
Again, let’s work through what it would have looked like with the Assistive Tech Impact Fund:
- The p(others would fund our venture portfolio) is low — perhaps ~40%. While there were a couple of players in the space when we launched in 2020, it wasn’t) many. Funding for persons with disabilities is still overlooked, relative to other health domains like infectious disease — let alone catalytic capital for new ideas.
- The years gained by doing it now is high — let’s go with the max of 10 years. Governments, markets or culture shifts would not, we believed, meaningfully scale assistive tech across the vast majority of Africa. Stretched health budgets, a lack of ‘payer’ in most cases, limited advocacy, and limited technological progress mean there’s little medium term potential for progress towards social return without catalytic capital.
The lower the result of the equation, the better. In our case, we’d score (40% / 10) = 0.04.
A high score (say >0.15), and we should consider the wisdom of the fund — your portfolio would be funded anyway, and the biggest sources of capital (governments and markets) and behaviour change are already primed to scale things without you.
A mid-level score is a bit more complicated. It means either:
- p(others would fund our venture portfolio) is high. This could be a prompt to partner with others: pooling capital, splitting up target geography, and so on.
- Years gained by doing it now are low. If the thesis space is urgent, it might still be worth jumping in to accelerate the timeline further. A fund to mitigate CO2 emissions might fall here.) Or directing your capital to something more catalytic.
Armed with these three formulae, we should be able to say:
We estimate this fund has a [x]% chance of achieving [y] social return.
And based on the landscape, we should [describe course of action]
And more importantly, we should have some critical thinking and conversations under our belt. Capital is such a powerful lever for social return — we owe it to ourselves to use it in the smartest possible way.
¹ I discuss what the journey to national-level scale looks like in this piece.
² The problem persists. Today, only 10-25% of the 200M needing access to an assistive tech device have one, according to a landscape analysis by Mastercard Foundation.
³ ~10% is 135M as a rough percentage of Africa’s total population in 2021
⁴ Using WHO data on DALYs averted from spectacles, wheelchairs, prosthetics and hearing aids. It’s relatively low, as spectacles account for the majority of unmet need.
⁵ There might be other metrics to consider. For example, every $1 spent on providing assistive tech gives a user $9 of extra income over their lifetime. We’ll need to consider lifetime income separately for both baseline / breakthrough ventures.
🤔 Got thoughts? Don’t keep them to yourself. Email me on asad@asadrahman.io. Let’s figure this out together.
If you enjoyed this, subscribe to get pieces just like it straight to your inbox. One email, every so often (and nothing else).
Banner depicts Conarky, the capital of Guinea. From Wikimedia Commons.


